
This video contains proprietary information and cannot be shared publicly at this time.
Figure 1
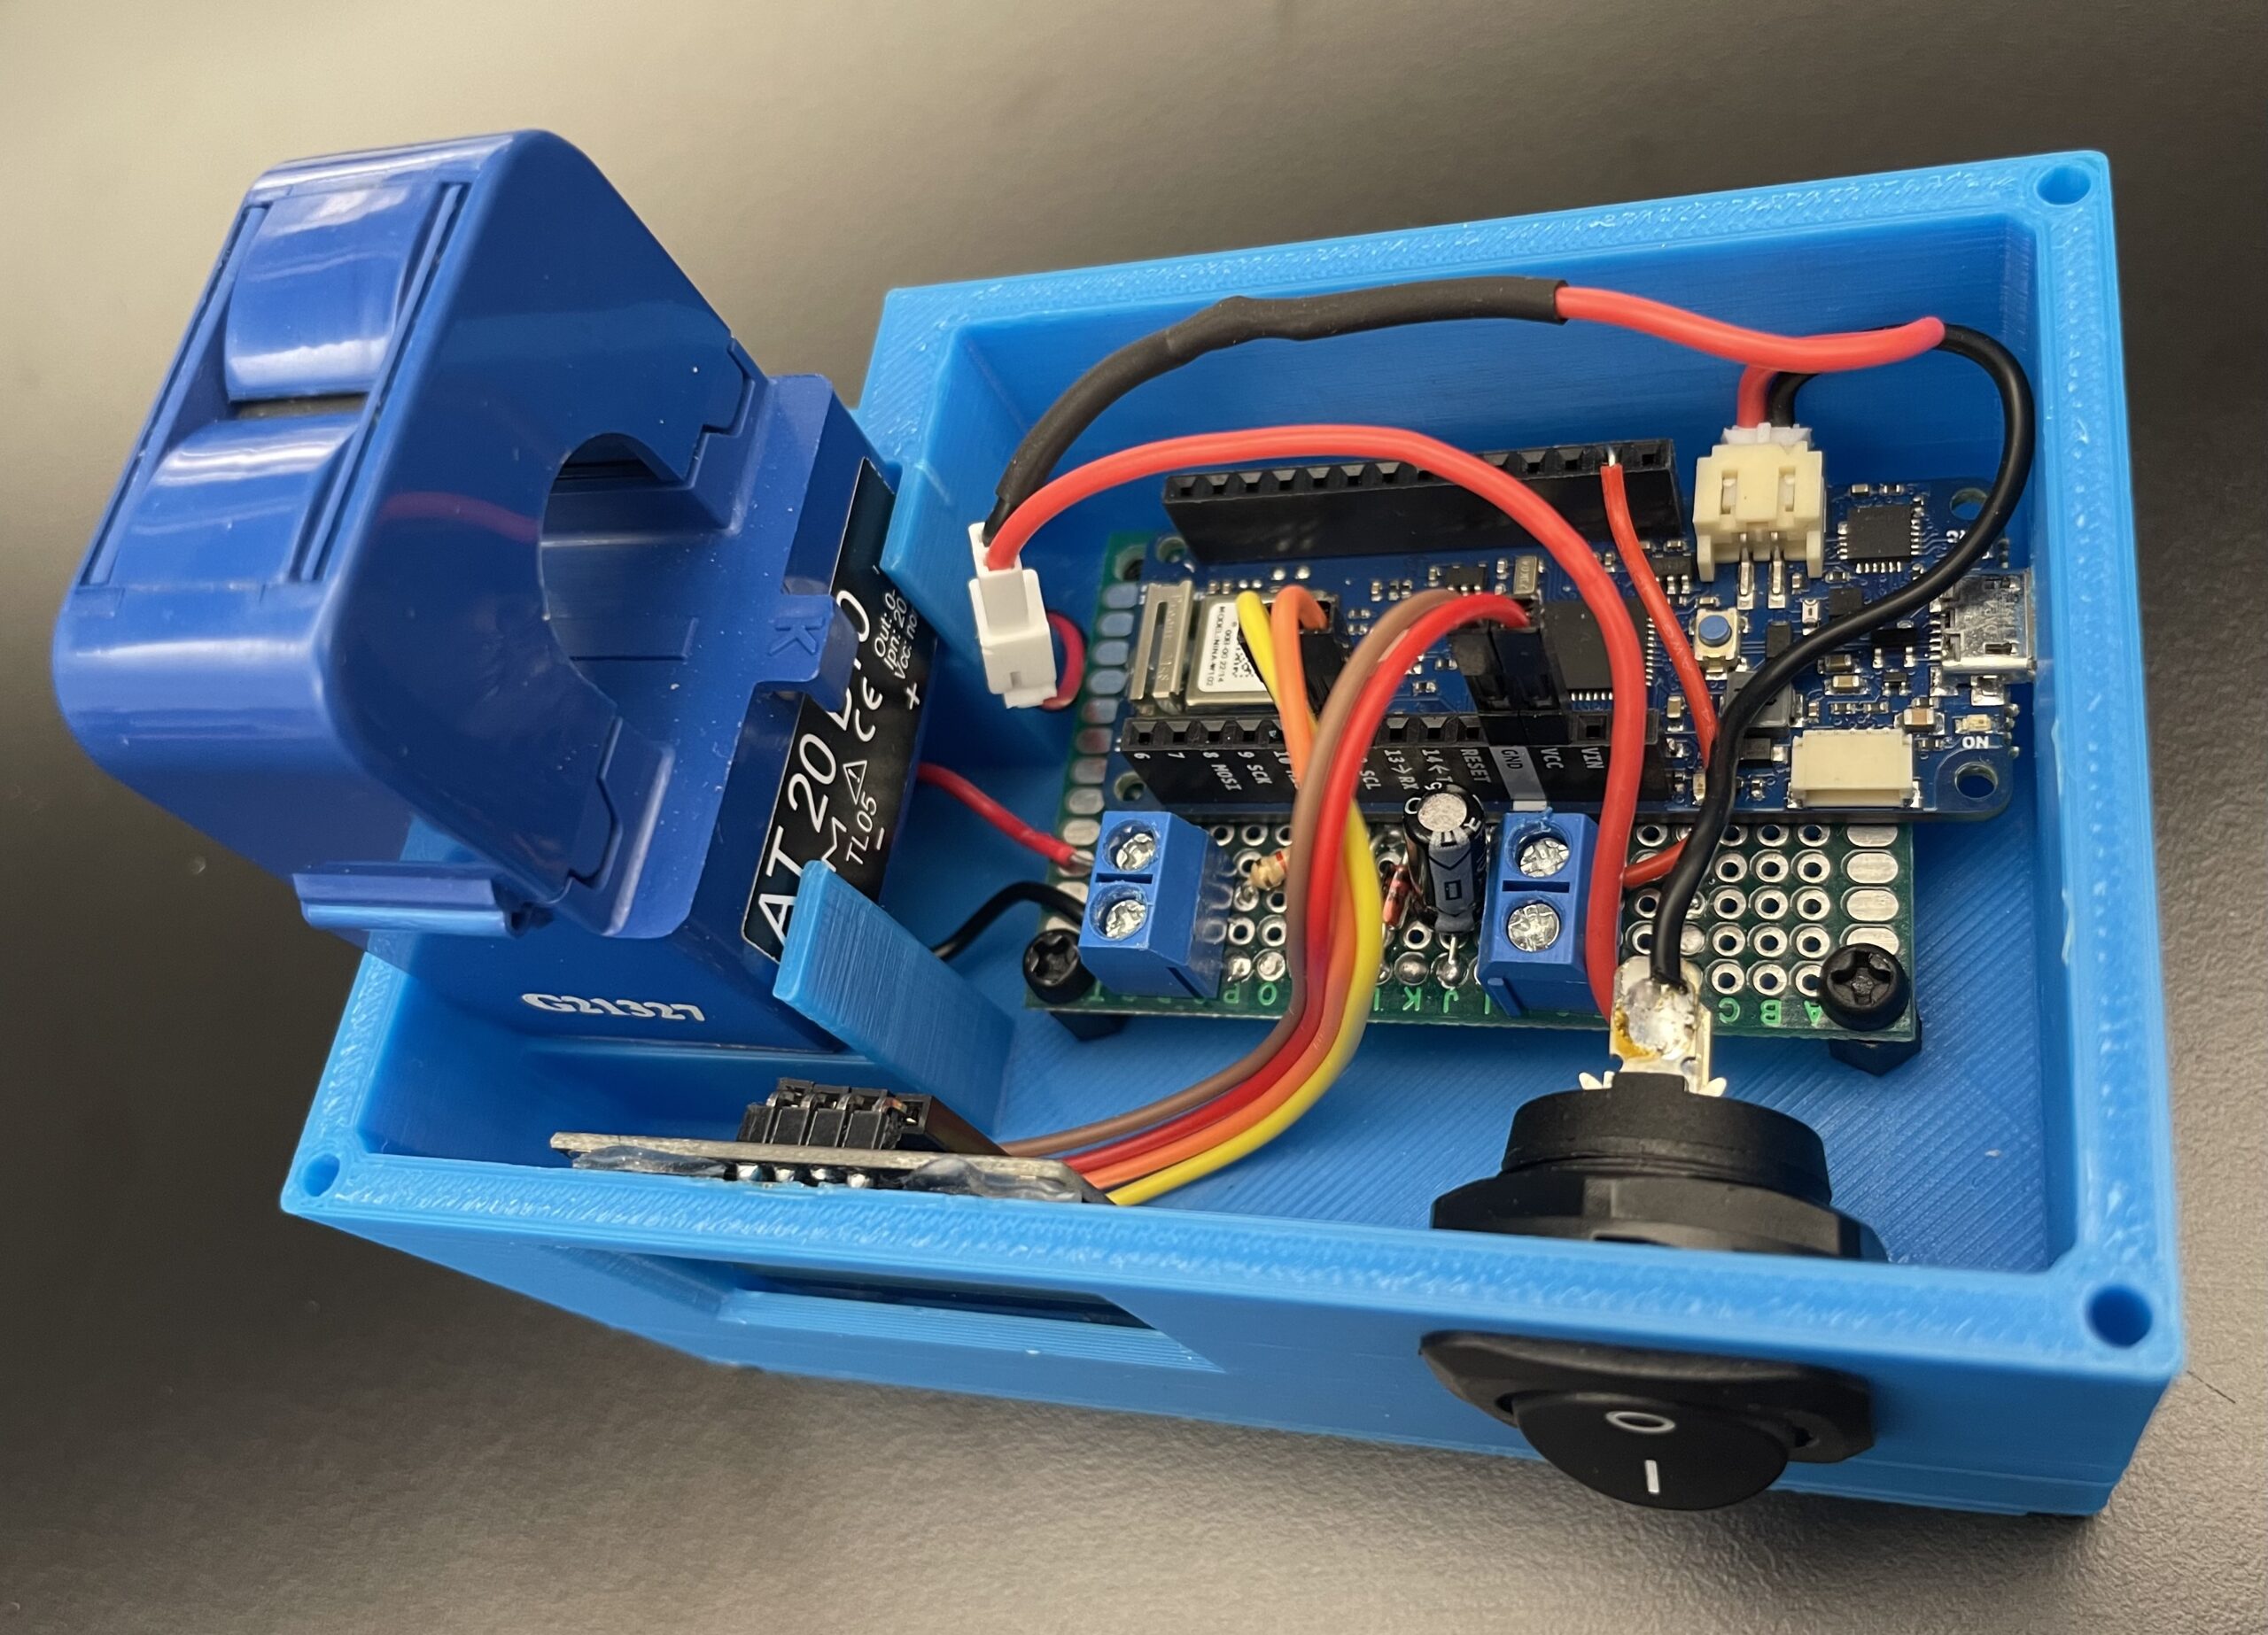
Figure 2
Team 9
Team Members |
Faculty Advisor |
Zihao Fu |
Liang Zhang (ECE), Yuan Hong (CSE) Sponsor Other |
sponsored by

Wireless Current Transducer for Remote Energy Monitoring: An IoT Device
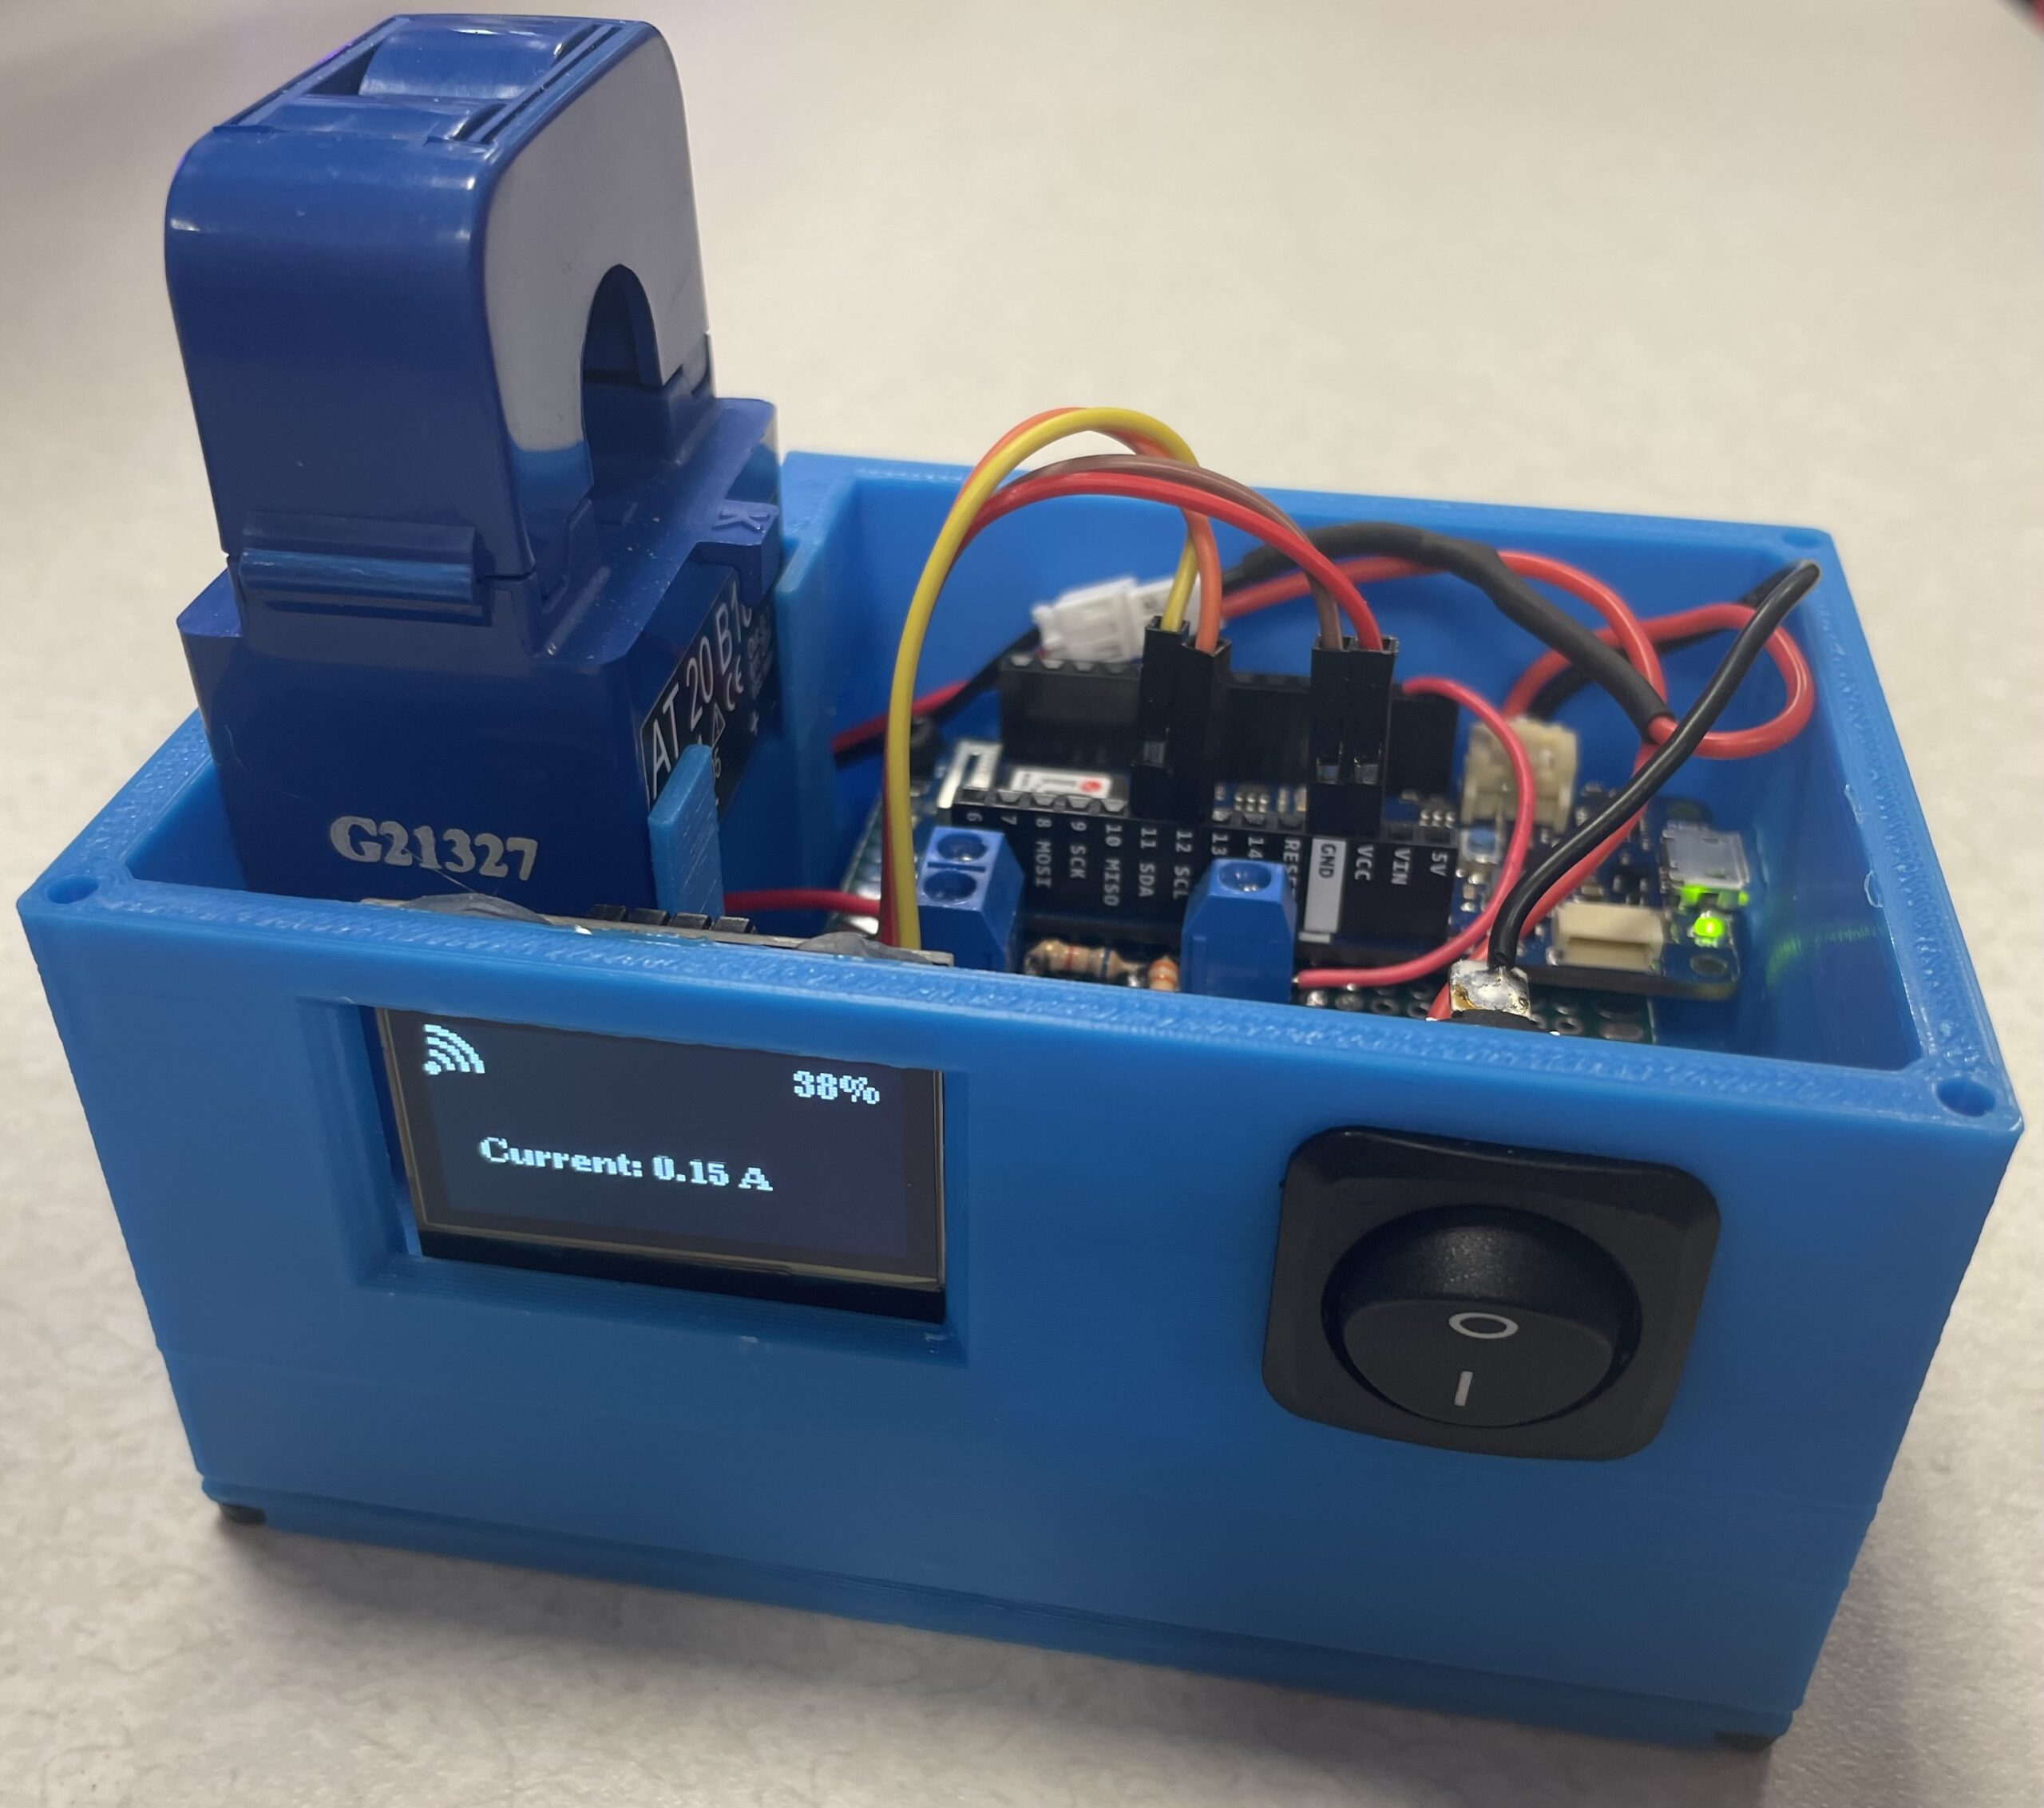
The sponsor for this project is the Southern New England Industrial Assessment Center (SNE-IAC) at UConn. The SNE-IAC provides free energy assessment for small and medium-sized manufacturing companies in the tri-state area to save energy, improve productivity, and reduce carbon emissions. During audits, current transducers (CTs) and data loggers must be attached for energy monitoring to detect energy usage trends. It is desirable to have one single device that can accomplish accurate current sensing, data storage, and reliable transmission to tabulate and graphically view data. This should all be contained in one unit, thus making it an Internet-of-things (IoT) device. The ECE team was responsible for incorporating a CT that can read current data at a user-selected sampling frequency which is stored on an Arduino MKR Wi-Fi 1010 microcontroller. The device is powered with a 3.7V 10,000 mAh LiPo battery with an integrated on/off switch. An OLED display was incorporated to display internet connection status, remaining battery charge, and real-time current measurement for in-person monitoring. The device housing was modeled in three sections. The main body efficiently and securely contains PCB with circuitry and hardware. The top and bottom plates close the main body and battery compartment, respectively. The housing was 3D printed with approximately 144g of tough PLA filament and assembled with M3 screws and PCB standoffs. The microcontroller wirelessly transmits data at an interval the user selects via the online data visualization dashboard. The CSE team was responsible for reading and storing the transmitted current data in the cloud to visualize data in graphical and tabular form. The dashboard allows users to start tracking data, store, and view collected data by time, change sampling frequency, and clear the database.
Our team collaborated with Computer Science & Engineering 38,Electrical and Computer Engineering 22 on this project.
